When you’re working with iron and iron alloys—especially in the form of steel— as many Xometry customers do, it’s helpful to know exactly what phases, or structures, they go through as they’re heated, cooled, and shaped and how those impact their strength, hardness, brittleness and overall useability. This is when you’d need a reference point, like the iron-carbon phase diagram, which we’ll look (and nerd out) at together in this article.
What Is the Iron-Carbon Phase Diagram?
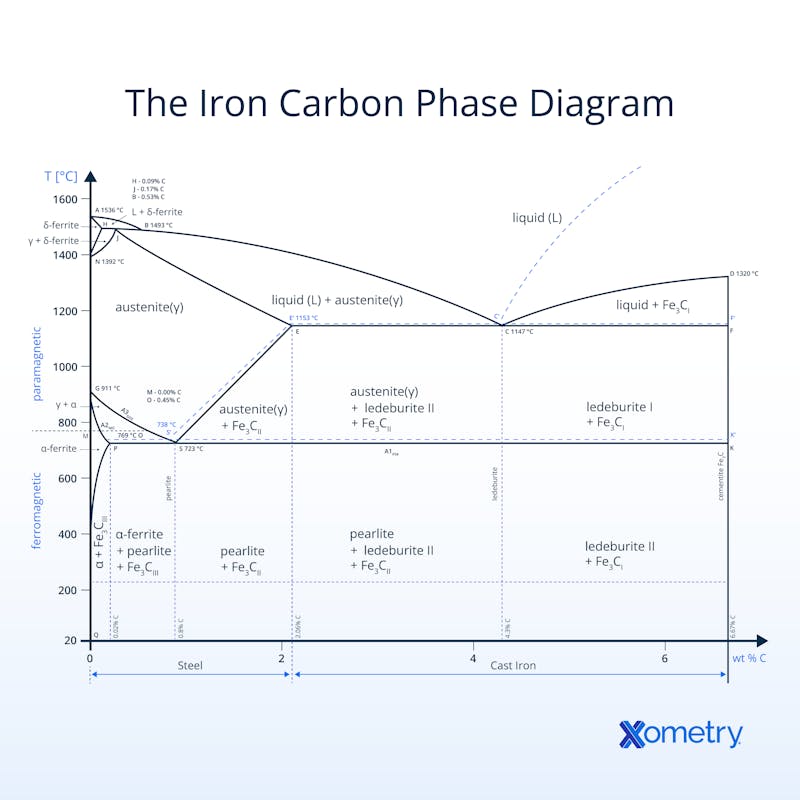
The iron-carbon phase diagram is simply a chart that shows the different structures (known as phases) of iron or steel as it goes through extremely hot or cold treatments. A scientist called Sir William Chandler Roberts-Austen created this guide in 1897 with information he pulled together using a device he invented that could measure the temperature of melted iron, and a microscope (an Adolf Martens, to be precise) that allowed him to see the metal’s grain structure. You may recognize the name because “austenite” was named after him. The diagram gives an idea of how different levels of carbon in the steel’s composition affect its changes and the chart features both paramagnetic and ferromagnetic steels. The best way to understand it, though, is to visualize the chart, which you can see illustrated below.

This diagram goes by several other names including the metastable iron-carbon, Fe-C, iron-iron carbide, and the Fe-Fe3C phase diagrams. All the names point to the iron-carbon relationship and how it handles different temperatures. It came to be with the help of several scientists’ work and the basis comes from a T-x diagram, which isn’t as comprehensive but was certainly the start of the full chart.
Having this visual helps metallurgists, engineers, and manufacturers understand changes in an iron alloy’s microstructure, temperature phases and composition shifts - this isimportant to know when it comes to choosing the right alloys. This accurate and researched-backed diagram will guide you on when to harden, cool and heat different alloys, but it draws the line at offering any information on surrounding iron-carbon phases, i.e., you won’t find the non-equilibrium martensite phase here. And, it also won’t tell you anything about heating and cooling rates for different steels and phases, or exact phase properties.
How It Works
If you look at the chart, you’ll see the temperature and the carbon content (as a percentage of weight) are plotted on the Y and X axes respectively. There are also segments that horizontally span the graph, which represent a different phase in the changing of the iron-carbon microstructure. There are also temperatures like 723℃, which is considered the critical or A1 temperature, meaning that any austenite in iron will turn into the eutectoid pearlite and double how much ferrite is in its structure. The chart also shows how two iron-carbon alloys can have the same chemical composition, they won’t necessarily have the same microstructure.They’ll be in varying phases at different temperatures.
Heat treatment is used to change the iron-carbon alloy’s microstructure, which is another reason you’ll need this diagram. If, say, you’re cooling pearlite at a rate of 200 ℃ per minute, the hardness you’ll be able to achieve is 300 DPH. If you up the temperature to 400 ℃ per minute for cooling, then you can increase the hardness to 400 DPH. This happens because carbon doesn’t get as much time to move through the lattice structure of pearlite. If you take it a step further and liquid quench the pearlite at 1,000 ℃, carbon can’t move at all and you can achieve the hardest and most brittle martensite structure.
Structures
Each phase’s atoms are arranged in a different way, and this arrangement is called the crystal structure. The properties, like strength or flexibility, will all depend on which structure category the phase falls into. Here’s a brief explanation of the five most common crystal structure types:
Body-centered cubic (BCC) crystal: This structure is like a cube with an atom in each corner and one slap bang in the middle. It’s strong but not very flexible, so materials with this type (like ferrite) tend to break easily, even though they’re most times hard.
Body-centered tetragonal (BCT): This is very similar to BCC, the only difference being that it’s stretched in only one direction—something that makes it very strong and hard. Not that you’ll be surprised, but martensite has a BCT structure.
Face-centered cubic (FCC) crystal: Just like with BCC, with FCC there is an atom at each corner of the cube, but this one has an extra one in the middle of each of the cube’s faces. Materials that fall into this category (like austenite) are flexible and ductile.
Lamellar: Materials that have this structure have thin alternating layers made from two materials: soft and ductile ferrite, and hard but brittle cementite.
Orthorhombic: This is a rigid and hard structure that we can describe kind of like a stretched cube with sides of all different lengths. Cementite is orthorhombic, which is why it’s both tough and brittle.
Phases
The phases you’ll find expressed on the iron-carbon diagram are explained in the table below:
| Name | Phase Type | Structure | Characteristics |
|---|---|---|---|
Name δ-ferrite | Phase Type Nearly-pure, low-carbon iron | Structure BCC crystal | Characteristics Ductility, magnetic, low strength, stable up to 912°C, turns into austenite at higher temperatures |
Name γ-austenite | Phase Type Solid | Structure FCC crystal | Characteristics Non-magnetic, soft, ductile, stable up to 1,395°C, converts to ferrite at higher temperatures |
Name α-ferrite | Phase Type Low-carbon iron | Structure BCC crystal | Characteristics Good fatigue management, quite strong, formed by cooling from austenite |
Name Cementite | Phase Type Iron carbide (Fe3C) | Structure Orthorhombic | Characteristics Hard, brittle, corrosion resistant when treated, forms above 7% carbon |
Name Ledeburite | Phase Type Mix of austenite and cementite | Structure Eutectic mixture | Characteristics High melting point (1,147°C), found in cast iron, high carbon content (4.3%) |
Name Pearlite | Phase Type Alternating layers of ferrite and cementite | Structure Lamellar | Characteristics Strong, tough, forms when cooled slowly |
Name Martensite | Phase Type Quenched austenite | Structure BCT | Characteristics Extremely hard and brittle, formed by rapid cooling (quenching) of austenite |
Phases
Reactions
There are two factors that have the biggest impact on determining what phase iron-carbon alloys are in—temperature and carbon content. This happens through different types of bonding, which we’ll describe below.
- Eutectoid: This happens when one solid phase separates out into two solid phases after cooling, and is known as the “eutectoid point” (you can see this on the diagram at 0.8%wt and 723 ℃). This point is where austenite turns into ferrite and cementite, too.
- Eutectic: Similarly, this one also transforms into two solids—but from a liquid, and at the melting point, hardening as it cools.
- Peritectic: Though it’s rare to see, this reaction happens when a molten and solid phase forms a second solid phase.
Types of Steel Used
High, medium, and low carbon steels are the types of steel that can be referenced on the iron-carbon phase diagram—we’ve put a little bit about each in the table below.
| Carbon Steel Type | Carbon Content | Details | Applications |
|---|---|---|---|
Carbon Steel Type High | Carbon Content 0.60–1.50% | Details Strongest and hardest of the group, not as ductile. Can be corrosion-resistant as long as there’s no chromium or similar alloying element | Applications Cutting tools, springs, dies |
Carbon Steel Type Medium | Carbon Content 0.30–60% | Details Decent hardness, strength, corrosion resistance | Applications Shafts, axles, gears, machinery parts |
Carbon Steel Type Low | Carbon Content 0.05–0.30% | Details More ductile, malleable, and affordable than the others | Applications Fasteners, bridges, pipes, body panels |
Types of Steel
How Xometry Can Help
We have a lot of experience working with iron and steel here at Xometry, and we have numerous services that fall under this material category. You can get free, instant quotes on our website for processes such as metal 3D printing, sheet metal fabrication, sheet cutting, and tube bending.
Disclaimer
The content appearing on this webpage is for informational purposes only. Xometry makes no representation or warranty of any kind, be it expressed or implied, as to the accuracy, completeness, or validity of the information. Any performance parameters, geometric tolerances, specific design features, quality and types of materials, or processes should not be inferred to represent what will be delivered by third-party suppliers or manufacturers through Xometry’s network. Buyers seeking quotes for parts are responsible for defining the specific requirements for those parts. Please refer to our terms and conditions for more information.


