Understanding the different stresses a material experiences is the key to knowing how it’ll respond when it’s a product and facing pressures and tensions in the real world. When you have an idea of how it’ll hold up, you’ll have science-backed peace of mind about the materials you choose and know just how far something can stretch, bend, or compress before it breaks and deforms. One handy concept that falls under this umbrella of stresses is the measurement of yield strength, which we’ll explore more in-depth up ahead.
What Is Yield Strength?
Yield strength tells engineers when a material goes from elastic deformation to plastic deformation, with the former being something it should bounce back from and the latter a point at which it can no longer return to its original shape or form. It can be calculated through a specific formula, which we’ll get to. But first, it’s important to understand how it looks plotted on a graph and what other points exist on a stress-strain graph.
Breaking Down the Yield Strength Diagram
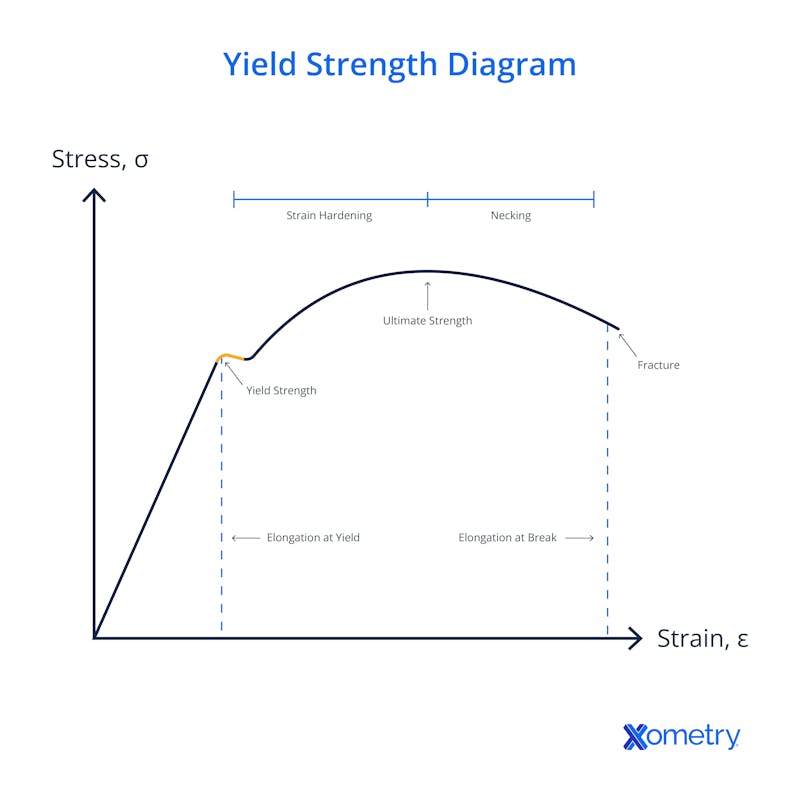
To get a visual representation of yield strength, you can place points on a stress-strain curve—but yield strength isn’t the only thing that can be calculated and featured on this graph. Below, you can see an example of how it looks, and we’ll break down the other features you’ll notice.

Yield Point
This is the point that shows when plastic deformation begins and gives manufacturers and engineers an idea of how a material will hold up under tensile strength. When you’re plotting it yourself, after calculating the formula, you’ll find that it exists where the linear portion of the stress-strain curve ends and where the non-linear portion starts. Interestingly, you’ll also notice that some materials have two yield points, like mild steel.
Elastic Limit
Looking at this point tells you the maximum amount of strain a material can handle just before it deforms permanently. Once the stress lets up, it will bounce back to its original shape, but if you push it past this limit, deformation will occur. It’s the last stop on the road to deformation before the yield point appears.
Proportionality Limit
You’ll find this point sitting at the end of the linear portion of the stress-strain curve and it shares the point when stress and strain are no longer directly proportional to each other. To find this number, you’d use Young’s modulus, also known as the modulus of elasticity.
True Elastic Limit
This point isn’t often used, but it shows when a material’s crystalline structure starts shifting under stress—specifically the lowest amount of stress when this starts happening. The reason why it’s rarely shown or thought too much about is because it’s a tough point to detect.
Upper and Lower Yield Points
The upper yield limit shows when the crystal lattice of the material begins seeing dislocations in its structure, but it’s heavily impacted by even the smallest influences on strain and the test equipment that’s being used, so it’s not entirely reliable when it comes to design and engineering choices. The lower yield point, however, is much easier to repeat in testing and is the period when Luders bands appear in a test section, just before the strain hardening begins.
Offset Yield Stress
This is also called proof stress, and it’s the most common method of describing a material’s yield strength. You can find it by drawing a line that’s parallel to the linear portion of the stress-strain curve. Where this point and the stress-strain curve intersect is the yield strength.
Necking and Fracture
These aren’t points on the curve, but rather things that can happen to a material during testing for its yield strength. Necking is a form of deformation that happens before a fracture occurs at peak engineering stress levels, and it usually is limited to a specific part of the material. Then a fracture or a break will take place. Once necking occurs, then the stress will decrease because the sample’s area has decreased.
The Formula for Yield Strength
To calculate yield strength, you can rely on the formula that’s always used for determining stress in general. You can see how the formula looks written out, below.

Yield strength formula.
The symbol F in this equation stands for applied force, and A0 is the cross-sectional area of the material specimen you’re testing.
The value is normally expressed as Pascals (Pa), the SI unit for stress, or in pounds per square inch (psi). Yield strength is usually written as σY, which uses the Greek letter Sigma to stand for engineering stress and Y for yield. You also might find it written as SY.
Examples of Yield Strength Values
Comparing materials can often give the best idea of how yield strength is represented and what typical values look like—we’ve put a handful of examples here:
- Steels: It’ll depend on how the steel is forged, formed, and created, but hot rolled A36 steel hovers around a low 220 MPa, and steels that have been oil-quenched or tempered can have a higher value of up to 1,570 MPa.
- Stainless steels: The range for stainless steels can start around 250 MPa for an austenitic stainless steel, whereas a precipitation-hardened stainless steel can have a yield strength of up to 1,000 MPa.
- Aluminum alloys: These tend to be lower than steel, but higher than plastic. A 1100 grade of aluminum has an average yield strength of about 24 MPa, whereas a 7075 aluminum has one of about 483 MPa.
- Plastics: Depending on the plastic you’re working with, you can expect a yield strength of 4 MPa for something like a plasticized PVC and 300 MPa from a carbon-fiber filled polyamide.
How Xometry Can Help
We have a wide range of services that cater to all kinds of materials with various yield strengths, from plastic to metal. You can get a free quote for plastic extrusion, metal extrusion, sheet cutting, plastic 3D printing, and metal stamping on our website.
Check out our Technical Datasheet Glossary to learn more about different material properties.
Disclaimer
The content appearing on this webpage is for informational purposes only. Xometry makes no representation or warranty of any kind, be it expressed or implied, as to the accuracy, completeness, or validity of the information. Any performance parameters, geometric tolerances, specific design features, quality and types of materials, or processes should not be inferred to represent what will be delivered by third-party suppliers or manufacturers through Xometry’s network. Buyers seeking quotes for parts are responsible for defining the specific requirements for those parts. Please refer to our terms and conditions for more information.


